
See which clients, partners, and industries make money, with WIP, AR, and realization updated daily from CCH Axcess or Practice CS. Then price, hire, and grow on evidence.
Median fee growth slowed to 6.7%, and the firms pulling ahead know their numbers better than the rest. No dashboard settles these questions alone; each takes judgment and deeper analysis. Each one starts with a number partners can trust.
“Without data, you're just another person with an opinion.”
2.4×
net income per partner at top-quartile firms vs. the median. Top performers right-size clients that don't fit, which frees them for more advisory work.
AICPA & CPA.com MAP Survey, 2025
Start with
Gross margin by client
Client Profitability dashboard
66%
of firms raised prices last year to improve profitability. Advisory margins (20–24%) still trail individual tax returns (28%).
Thomson Reuters Institute, 2026
Start with
Average effective bill rate
Firm Overview dashboard
51%
of midsize firms say talent shortages constrain what they can take on, against 40% of firms overall.
Thomson Reuters Institute, 2026
Start with
Billable % by staff member
Time Entry dashboard
75
of the Top 100 firms grew their CAS practices in 2025, the most common source of growth on the list.
Start with
Billings by service type, this year vs. last
Client Profitability dashboard
225
mergers reported by Top 100 firms in 2025, up from 122. Buyers test realization, utilization, write-offs, AR, WIP, and client concentration.
Accounting Today, 2026 Auxo Capital Advisors, 2026
Start with
Billings growth, year over year
Firm Overview dashboard
40%
of firms haven't worked out how to track efficiency gains from technology, though 61% raised fees to pay for it.
AICPA & CPA.com MAP Survey, 2025
Start with
Revenue per work hour, year over year
Firm Overview dashboard
Each one is built around a problem partners already know, and runs on your own CCH Axcess DAU or Practice CS data.
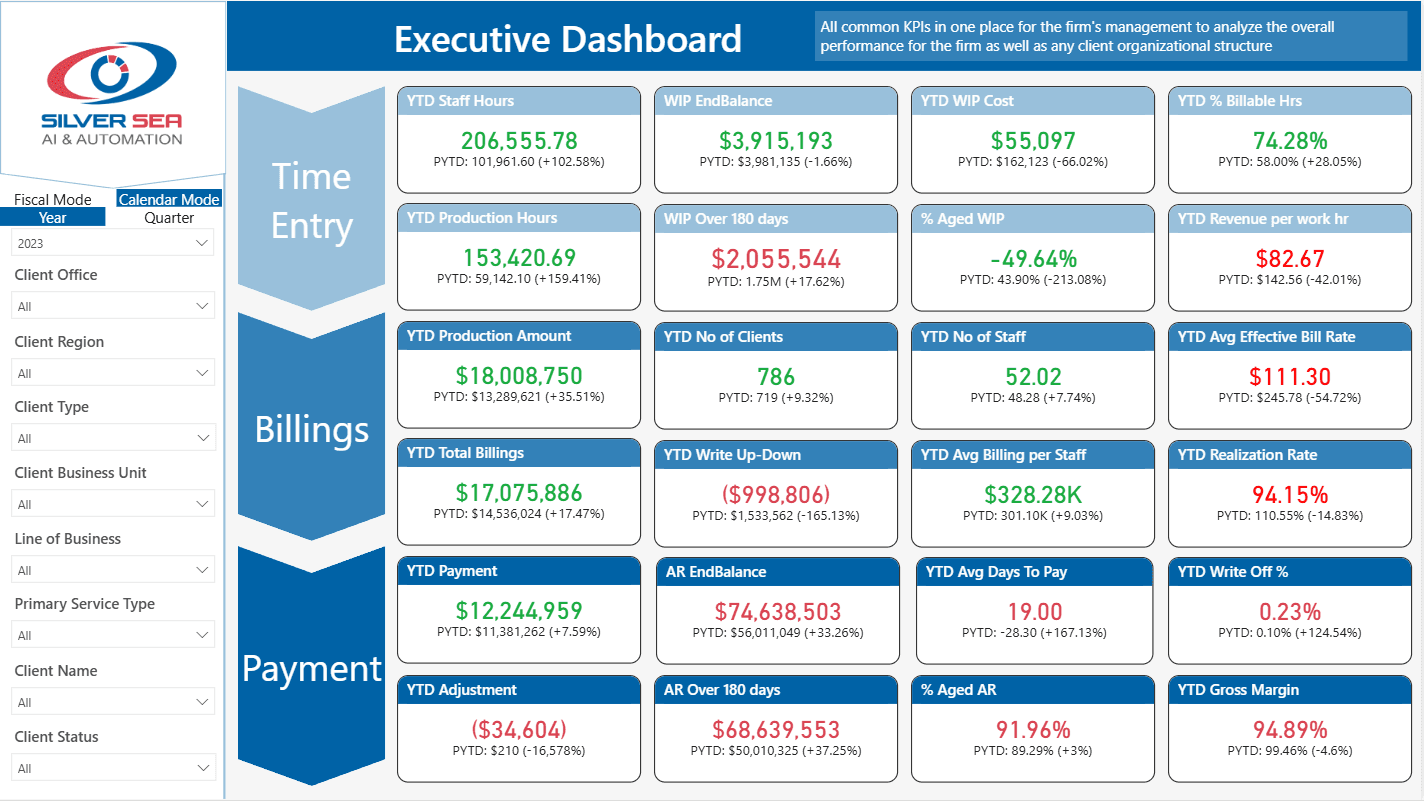
Firm Overview
“Every partner meeting started the same way, someone pulling up last month's numbers while we tried to make decisions about this month.”
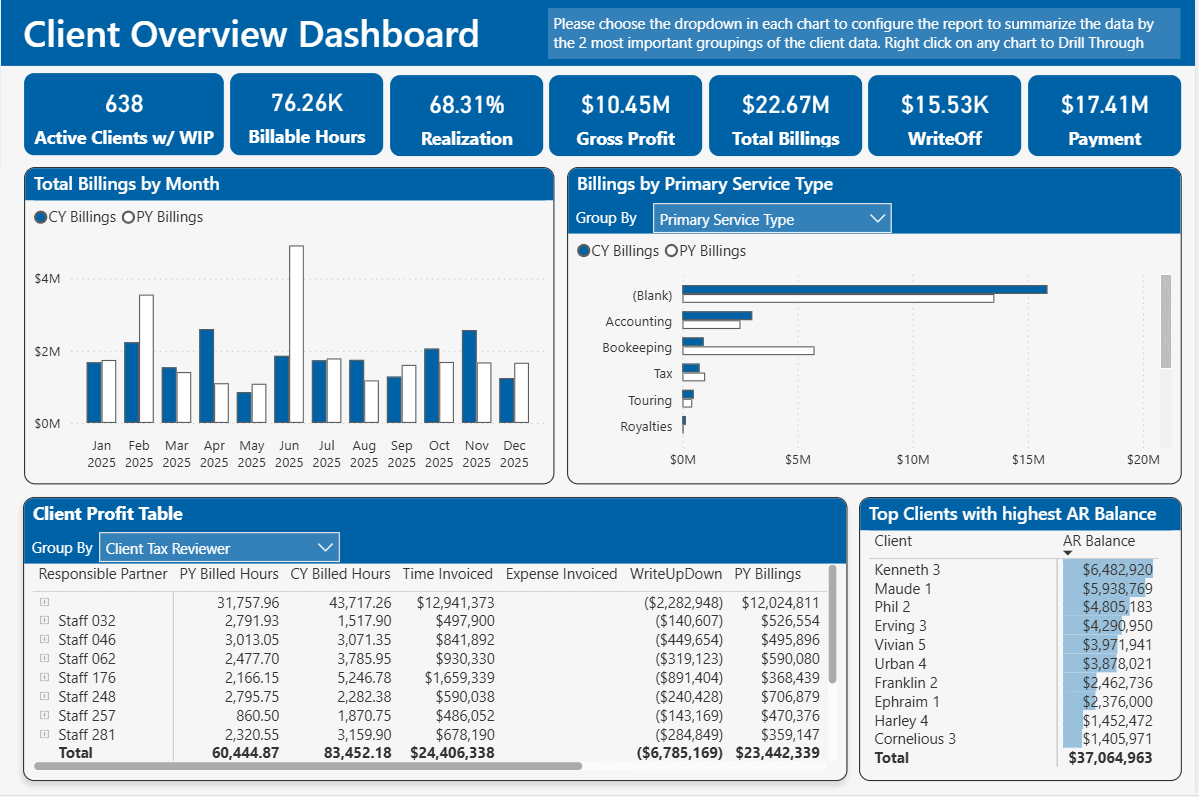
Client Profitability
“We priced a recurring engagement based on last year's hours. Three years later, scope had doubled and the fee hadn't moved. Nobody could see it.”
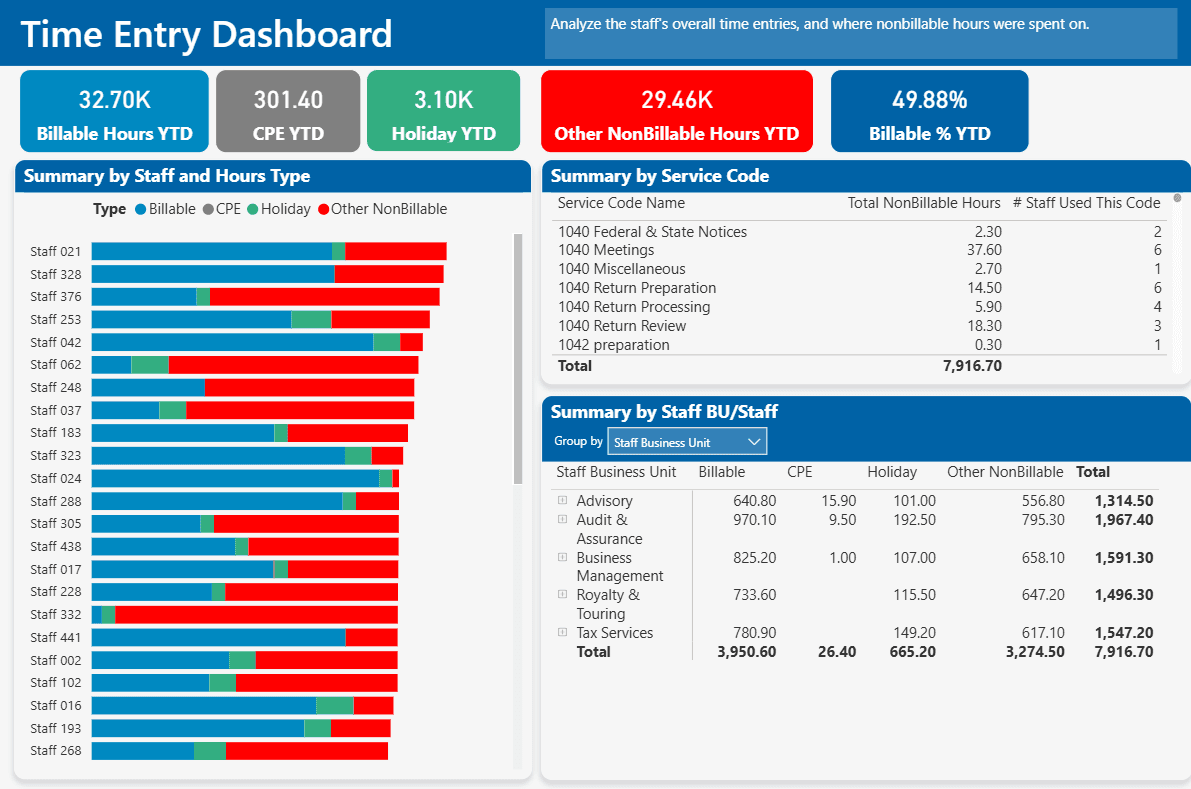
Time Entry
“Our billing cycle slipped two to three weeks every month because time wasn't entered on time. That's a visibility problem we didn't know we had.”
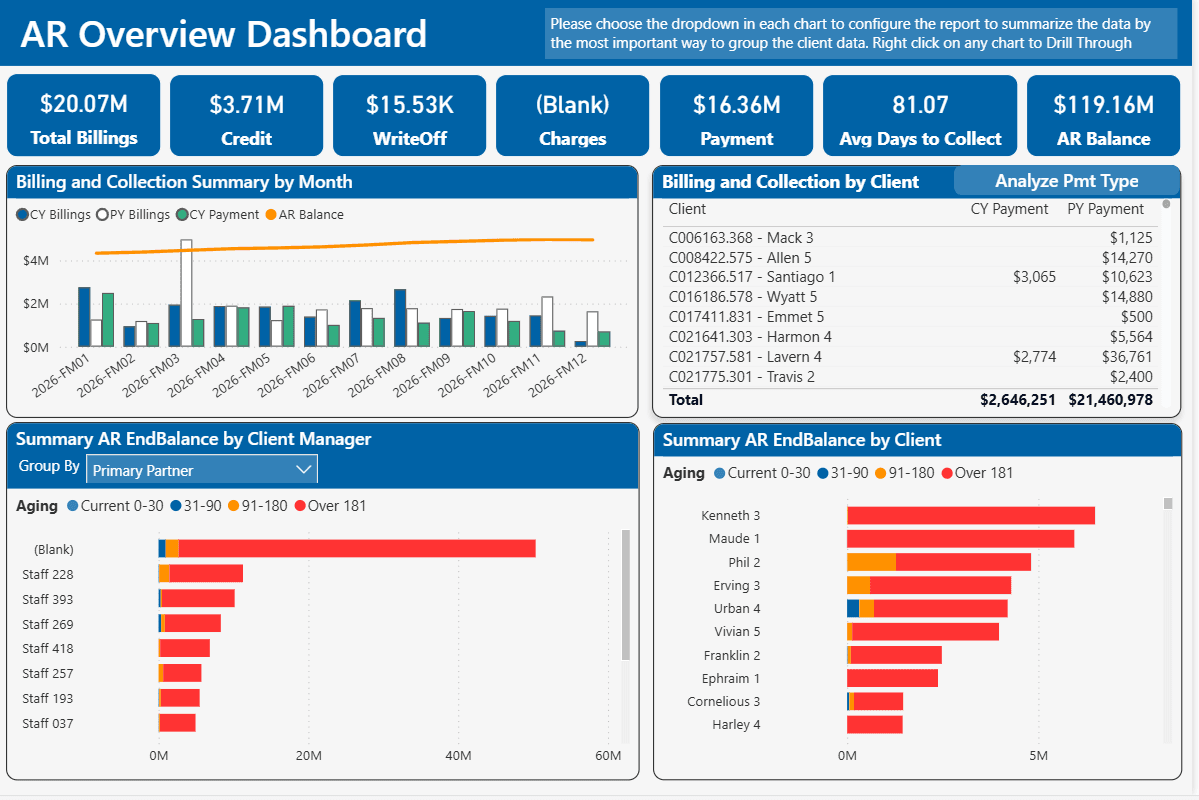
AR Overview
“A long-term client let an invoice sit for four months. We found out when they called us, not the other way around.”
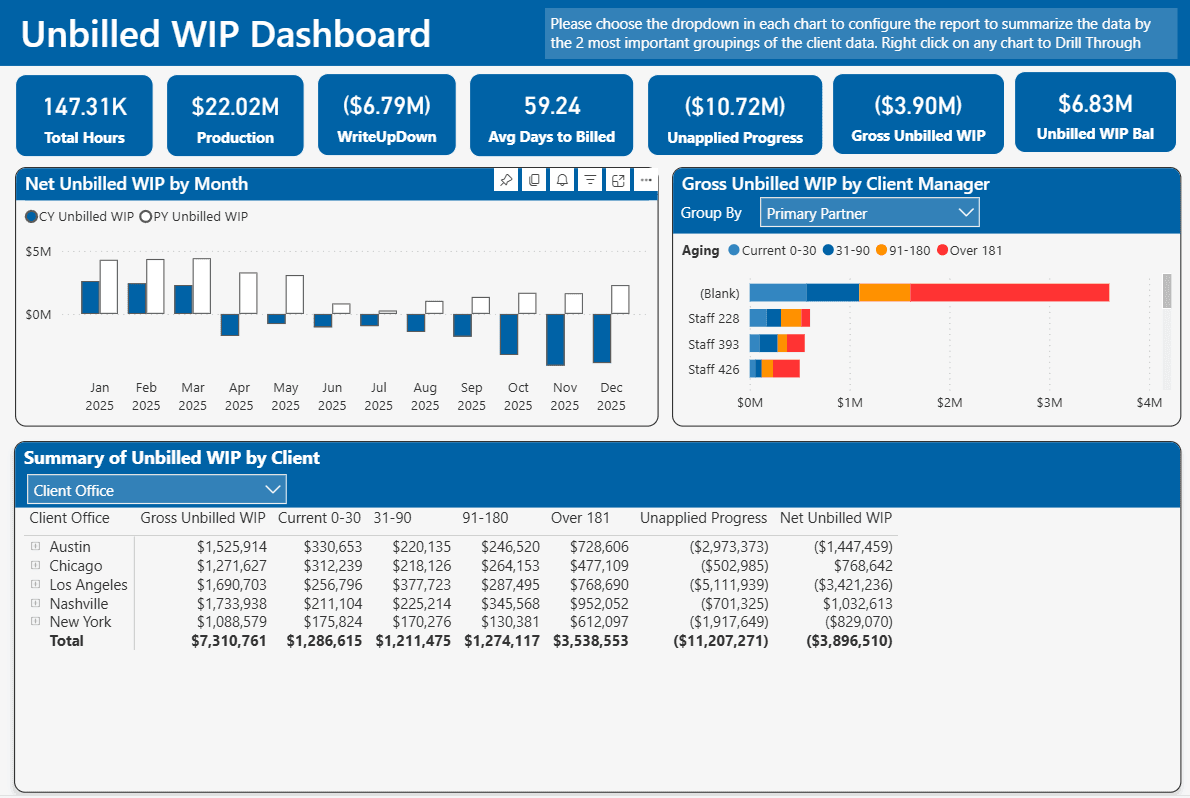
Unbilled WIP
“We finished a major engagement in August. The write-off showed up in December. Five months of work sat in a spreadsheet nobody was watching.”
The difference isn't reports saved. It's decisions made before the window closes.
The question
Reactive, manual report
Proactive, with daily dashboard
Which clients are we losing money on?
Reactive:Found when a write-off or fee review forces the question.
Clients sorted by margin, with negative-margin clients at the top.
How much finished work is still unbilled?
Reactive:Found at billing time, or when it's written off.
WIP over 181 days by partner and office, and the average days to bill.
Which clients are slowing down on payment?
Reactive:Found when a balance is already 90+ days old.
Balances past 90 days by client and partner, largest first, and the average days to collect.
Is the team stretched or underused?
Reactive:Found when deadlines slip or overtime piles up.
Billable and non-billable hours for each person, and the service codes the non-billable time goes to.
Are we growing where we meant to?
Reactive:Found when the year's numbers are closed.
Which service types billed more than last year, and which billed less.
What about the question nobody built a report for?
Reactive:Waits until someone builds the report.
Type “top 10 clients by write-offs this year” and get a chart back.
 Sid NuenoChief Operating Officer, TPS Hayer
Working with Steven and the team at Silver Sea has been transformative for our business. They developed an automation solution that generates our weekly and monthly reports, seamlessly transforming the data into an insightful dashboard. Saving our team a few hours each week and given us almost real-time insights that were previously hard to get. Even without the DAU, we now have a BI dashboard that allows us to analyze our operations in ways we never could before. We couldn't be happier with the results!
 Reid GavinCOO, Machen McChesney
Steven and Silver Sea have been transformative for our firm! They helped us get the CCH DAU up and running and also supported us with other vendors requiring connection with our CCH system. Steven is very responsive and understands the needs of a growing CPA firm. I recommend Silver Sea to any firms looking to improve data utilization/visualization.
No IT project. No workflow disruption.
We review your system, data, and needs. NDA signed here.
We connect to DAU or Practice CS, validate data integrity, apply your branding. You approve before go-live.
Each dashboard, using your firm's own numbers.
Two weeks of adoption support, then a monthly retainer with unlimited updates.
Power BI launch
$3,500one time
Monthly retainer
$1,500per month
Dashboards go stale when nobody maintains them. You get four weeks of hands-on support after go-live, then a retainer with unlimited updates, so the dashboards change as your firm does.
A kickoff call, a sign-off before go-live, and the leadership walkthrough. We handle connection, validation, and configuration. Most firms are live within two weeks.
There's no quiet season, so we do the heavy lifting: two meetings to go live. Most firms surface $20,000–$50,000 in unbilled WIP or overdue AR in the first month.
NDA before anything begins, an obfuscation script for the initial setup, and once live your data never leaves your own Microsoft tenant. The dashboards read it through a secure, read-only API connection.
CPA-firm data expertise takes years to build. At $1,500 a month we act as your fractional reporting department. Thomson Reuters' 2026 research found that high-margin firms are better at using metrics to track performance and cash flow, yet only 41% of firms track overall profitability.
No firm's data is completely clean. The dashboards surface the inconsistencies, abnormal transactions, and configuration issues, and that becomes the cleanup plan.
Fixed fee, no overruns: all six dashboards, the connection, data validation, the leadership walkthrough, and two weeks of support. Complete four weekly review calls and, if you still don't see value, we refund every dollar.
Power BI Pro is $14 per user per month, billed by Microsoft. Most firms need three to five licenses. Your data stays in your tenant.

Book a quick call. We'll walk you through a live demo on real firm data and tell you whether it's the right fit.